

- Posted bytsradmin
- Financial Content Writers, Content Writing- Forex Markets, Corporate Training in Financial Markets, Stock Market Content Writers, Financial Market Content Writing
- 0 Comments
Gold fundamentals, trend and analysis
Gold grossly underperforming asset classes, but the decline looks to be arrested..
International gold prices are down more than 30 percent since scaling the $1900 per troy ounce peak in the second half of 2011, making the asset class one of the worst performers in relation to both short and long- term financial instruments such as equities, debt, money market and a few others.
High- risk financial instruments such as equities and gold are perceived as long- term investments that result in capital growth. However, investors who have pumped in cash in physical gold, gold ETF’s and other financial instruments tracking gold prices are staring at huge losses and unless their investments in the precious metal comprised of only a small portion in the overall portfolio, they will have to wait a while longer for their investments to start delivering positive returns.
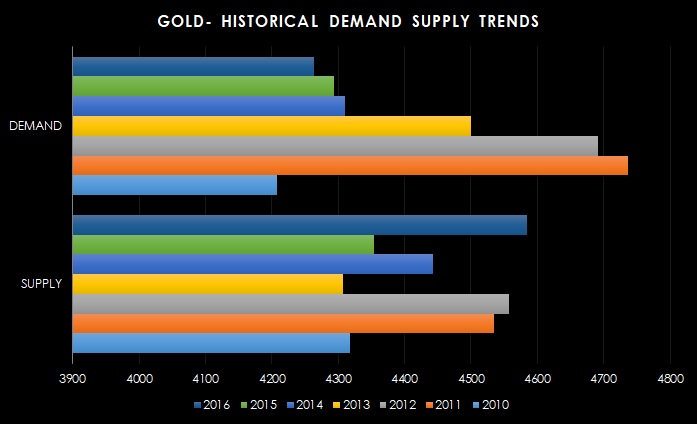
So what has led to the sudden demise in gold prices and what is holding them at multi- year lows, although the physical demand for the precious metal remains healthy?
The global financial crisis in 2008 that most people believe was caused by Credit Default Swaps (CDS) led Central Banks across the world to start purchasing large amounts of Government debt and asset- backed securities such as mortgage securities to prevent the crisis from snowballing that could lead to a meltdown in the global financial system.
In Europe, where the European Central Bank manages monetary policy of the countries within the euro- zone, the crisis reached a tipping point where some countries were not able to service their sovereign debt, leading to defaults. To arrest the situation and prevent the catastrophe from spreading to the other countries in the region, the ECB was forced to act by buying sovereign debt from the affected countries in addition to pumping liquidity into the banking system by taking away some of the securities from their hands, especially the ones which were backed by secure assets.
The financial crisis led to a historical fall in interest rates and inflation alike in all the developed countries and in spite of the crisis abating a few years back, interest rates continue to remain near the all- time lows, since consumer inflation is not picking up. Low inflation is extremely negative for gold prices as the precious metal is generally considered a hedge against inflation and since interest rates and inflation commonly have a positive correlation, only a rise in inflation will ensure a gradual increase in interest rates. In addition, the trillions of dollars’ worth of debt lying with the Central banks not only brought in liquidity to the system, but found its way into the financial and the real estate markets, pushing up prices to record levels, leading investors to shun gold and invest in the equity markets which dropped to record lows, following the crunch.
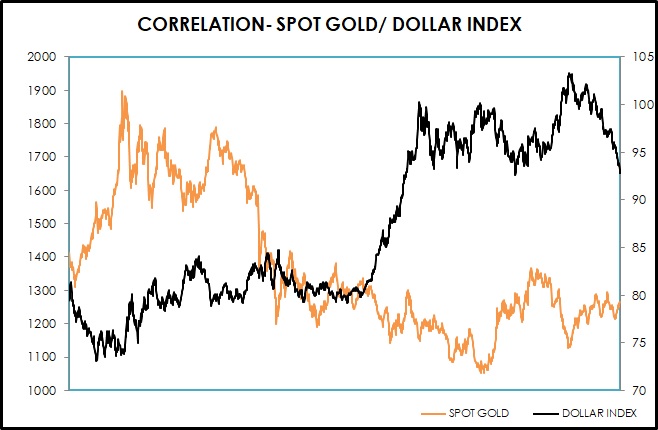
In addition to the negative correlation with the traditional asset classes, gold is also negatively correlated to the dollar which is sharply higher, especially versus the EURO and Pound Sterling, following the Brexit referendum. The DOLLAR INDEX is currently hovering close to its 11 years highs after slipping from the 103 mark, last seen in 2002. Although the fundamental factors are in favour of the precious metal, gold prices are likely to remain in a range near multi year lows until we see inflation firming, interest rates rising and an end to the easy money policy, especially in the euro- zone.
With Central banks in the US and the euro area holding the next monetary policy meeting in September, there definitely would be more clarity on the bank’s perception with regards to inflation and interest rates.
Chart analysis-
Since the beginning of 2017, gold prices have climbed about 10 percent from the lows of 2016 and the precious metal looks to have found a bottom around $1200/ troy ounce. The recent profit booking in global equities coupled with the fall in the dollar index has given fillip to gold, but prices continue to oscillate in a tight $100 band for most part of this year.
The overall trend in Spot gold remains bullish with prices holding above the long- term bearish trendline at $1250. Technically, immediate supports for the yellow metal are placed at $1265, a close below which prices could quickly slide to settle anywhere between $1200- 1250. On the upside, spot gold should settle above the top- end of its 3- month trading range, which is around $1290, to push towards $1320- 1350.
TakeStock Research delivers unique content for the financial services industry- FX, Equities and Commodities. Our content writing services include market commentaries, research articles based on fundamental & technical analysis, real- time coverage of global economic events, corporate earnings, trading advice on the global financial markets and marketing content. In addition, we also provide customer/ technical support for intermediaries in the financial services industry.


